
Need to Yield
The September 2025 economic environment highlights an intensifying “need to yield” as fundamental economic conditions reveal a system struggling to generate sustainable growth and productivity gains. With U.S. employers adding a dismal 22,000 jobs in August—far below the 75,000 estimates—and unemployment surging to 4.3%, the labor market’s failure to produce meaningful economic momentum highlights the broader challenge of extracting performance from an increasingly sluggish economy. The Bureau of Labor Statistics’ annual revision, which revealed a staggering loss of 911,000 jobs from the previous year’s data, compounds concern about the economy’s underlying capacity to deliver results.
Further, the U.S. manufacturing sector remains weak, with the ISM Manufacturing PMI remaining in contraction territory at 48.7 for six consecutive months. This signals that traditional industrial activity is failing to yield the productivity improvements necessary for sustained expansion. Even seemingly positive developments carry disappointing undertones, as Q2 GDP growth of 3.3% primarily reflects one-time factors rather than sustainable economic drivers that can consistently produce results.
China’s economic struggles mirror this theme, with retail sales slowing to 3.7% year-over-year (Y/Y) growth in July and exports declining to the U.S. for four straight months. This demonstrates how the world’s second-largest economy is unable to yield the growth rates that previously drove global expansion. The combination of persistent core inflation at 2.9% and weakening employment metrics creates a stag flationary environment where policymakers struggle to yield meaningful improvements through conventional monetary policy tools.
Much like early-season college football and NFL statistics that can mislead about true team strength, these initial economic indicators may not yet fully reflect the underlying structural challenges that will determine whether current policy interventions can yield the sustained recovery that markets desperately need.
U.S. Labor Market Slows Further Despite Upward Revision to GDP Report
As noted above, U.S. employers added just 22,000 new jobs to the economy in August, well below the 75,000 estimate. The unemployment rate increased to 4.3%. While the July report was revised slightly higher, the June report was revised down. Average hourly earnings grew 0.3% month-over-month (M/M) or 3.7% Y/Y. The broader U6 unemployment rate surged to its highest level since October 2021 at 8.1%. The BLS annual revision invites additional concern around the labor market. This labor market weakness was a key reason why the Federal Reserve cut the Fed Funds rate by 25 basis points at their September meeting.
However, the U.S. economy grew at a faster rate than previously thought in Q2 based on the second revision released at the end of August. Q2 GDP growth was revised up to 3.3% from the prior estimate of 3.1%. The revision stemmed primarily from upward revisions to investment and consumer spending that were partly offset by downward revisions to government spending as well as an upward revision to imports. Consumer spending rose 1.6% as opposed to the initial estimate of 1.4% growth. This strong rebound comes on the heels of Q1’s negative GDP growth, which was heavily impacted by imports in advance of tariffs.
Source: U.S. Bureau of Economic Analysis
Will the Tariff Impact on Inflation be a One-Time Event?
The PCE price index showed that core inflation ran at a 2.9% seasonally adjusted annual rate in July, meeting estimates but increasing from June. Headline PCE rose 0.2% M/M or 2.6% Y/Y. CPI inflation increased more than anticipated in August. Headline CPI increased 0.4% M/M or 2.9% Y/Y while core CPI jumped 0.3% M/M or 3.1% Y/Y. The negative impact from the CPI report was largely offset by a surge in unemployment claims, which rose to a near four-year high.
PMIs Rebound in the U.S. and Eurozone Last Month!
The manufacturing sector in the U.S. gained a bit of strength in August, but overall activity remained in contraction territory for the sixth straight month. The ISM Manufacturing PMI increased from 48.0 in July to 48.7 in August. New orders and employment strengthened last month, but the prices and production components weakened. Survey respondents cited uncertainty and softness in the manufacturing environment. Economic activity in the services sector grew in August for the third consecutive month. The ISM Services PMI jumped from 50.1 in July to 52.0 in August, driven by strength in business activity and new orders.
The eurozone Composite PMI remained in expansion territory in August with a 15-month high reading of 51.1, up from 50.9 in July. Services weakened a bit last month, but manufacturing jumped back into expansion territory with a reading of 50.5 (a 38-month high). The eurozone’s largest economy, Germany, posted a third successive monthly increase in output during August on the back of a solid expansion in manufacturing production and the rest of the major eurozone countries posted solid readings. Despite the headwinds from U.S. tariffs and geopolitical issues, eurozone manufacturing and services appear to be on solid footing with economic growth that could see a small boost in Q3.
Higher Inflation May Limit Future ECB Action
Eurozone inflation edged higher to a 2.1% annual rate in August, up from 2.0% in the prior month. Core inflation, which strips out more volatile food, energy, alcohol, and tobacco prices, was unchanged from 2.3% in July. The closely watched services print was slightly lower in August, at 3.1% compared to 3.2% in July. After slashing borrowing rates over the past 18-24 months, the ECB is holding their key policy rate steady.
Exports to Europe & Southeast Asia Keeping China Afloat
China’s manufacturing sector unexpectedly returned to growth in August according to a private survey. The RatingDog Manufacturing PMI of 50.5 in August was an increase from 49.5 in July and was ahead of expectations. The improvement was driven by a recovery in new export orders, indicating the resilience of external demand in the face of tariffs. The results of this private survey was more upbeat than the official government reading, which showed manufacturing activity shrank for a fifth straight month in August, coming in at 49.4 compared with 49.3 in July. The official government non-manufacturing PMI index, covering services and construction, expanded to 50.3 in August from 50.1 in July. China’s exports growth has beaten expectations in recent months, driven largely by a surge in shipments to Southeast Asia and European countries, while shipments to the U.S. have declined for four straight months.
Source: China’s General Administration of Customs
China’s Retail Sales Slow Further While the Risk of Deflation Remains Quite High
China’s retail sales increased by 3.7% Y/Y in July 2025, slowing from 4.8% in June. The latest figure marked the weakest growth since December 2024, as sales moderated across several categories. Inflation in China rose 0.4% in July but remains flat Y/Y. Core inflation increased 0.8% Y/Y in July, up slightly from June’s 0.7% Y/Y reading. Producer prices extended their deflation streak to 35 consecutive months with a decline of 3.6% Y/Y in July.
Does Active Management Still Make Sense?
There is a lot of debate around the benefits of active equity management and whether it still makes sense as an investment strategy. Actively managed equity strategies have generally underperformed their respective asset class benchmarks over most time periods when factoring in the higher level of fees. Passively managed mutual funds and ETFs now represent ~55% of the industry and that figure is likely to grow. Financial markets have become macro driven over the past 15 years and concentration has surged into mega cap tech/growth stocks that generate the highest level of earnings growth. Small caps are being hurt by higher interest rates and non-U.S. equities are held back by sluggish growth projections.
While we believe active equity management still provides benefits in less efficient asset classes, systematic flows from 401(k) plans will continue to support the trend toward passive investing and therefore higher levels of market concentration. Active management should provide some level of risk management and downside protection, but a key question for investors is whether the downside protection offsets the years of missed gains during bull markets.

Sources: SPIVA | S&P Dow Jones Indices, Apollo Chief Economist
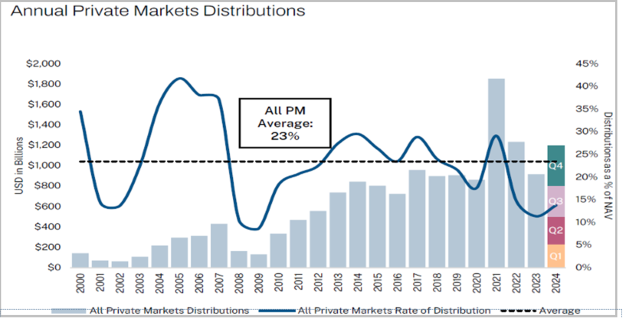
When Will the Distributions Improve?
Private markets remain sluggish with depressed exit activity impacting distributions and fundraising. IPO markets have improved in recent months, but distributions as a percentage of NAV are depressed. Over the past 25 years, distributions represented 23% of NAV per annum but they currently sit at ~15%.
Source: Hamilton Lane (January 2025)
The charts and information in this presentation are for illustrative purposes only, and are based upon sources of information that Sunpointe, LLC generally considers reliable, however we cannot guarantee, nor have we verified, the accuracy of such independent market information. The charts and information, and the sources utilized in the compilation thereof, are subjective in nature and open to interpretation. FOR USE WITH INSTITUTIONAL INVESTORS AND INVESTMENT PROFESSIONALS ONLY. NOT FOR PUBLIC DISTRIBUTION. PAST PERFORMANCE IS NO GUARANTEE OF FUTURE RESULTS.