Caving In!
After more than 40 days, the U.S. government shutdown finally ended when both the House and Senate approved formal votes, marking the longest closure in American history. While Washington grappled with the shutdown:
- The U.S. economy remained on solid footing with GDP growing 3.8% in Q2 and projections of continued growth through Q3.
- The eurozone showed signs of improvement with its Composite PMI hitting a 17-month high in October.
- China’s manufacturing sector continued to struggle, contracting to a six-month low and highlighting the divergent paths of major global economies. Adding to China’s economic woes, the newly completed Hongqi Bridge dramatically collapsed just months after opening, raising broader concerns about declining quality control in China’s infrastructure projects.
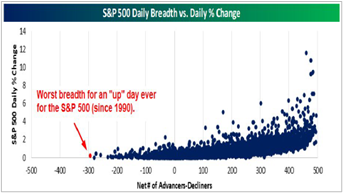
Despite the political dysfunction, financial markets showed remarkable resilience, though concerning signs are emerging in market breadth. October 28 set a record for the worst S&P 500 breadth ever on a positive performance day as mega-cap tech stocks continued to dominate while the broader market lagged. Despite these market concentration concerns, investors have focused on fundamental economic data and the Federal Reserve’s ongoing rate adjustment cycle.
As we navigate through this tumultuous period, it’s essential to maintain a diversified investment approach and keep perspective on the longer-term economic trajectory beyond the day-to-day headlines from Capitol Hill.
No data, no problem! CPI ticks higher as anticipated.
Economic data from the U.S. government has been limited during the shutdown, but the U.S. economy remains on solid footing. U.S. GDP grew 3.8% in Q2 and the Atlanta Fed’s latest estimate pins growth at 3.9% for Q3. Most economists’ project growth of 1.5%-3.0% during Q3 after the U.S. economy grew 1.5% in the first half of 2025. One of the widely anticipated data points released in October was the September CPI reading which came in below expectations. Headline inflation increased 0.3% month-over-month (M/M) or 3.0% year-over-year (Y/Y) in September with Core CPI coming in at a 0.2% monthly gain or 3% Y/Y. A 4.1% jump in gasoline prices was the largest contributor to a report that otherwise showed muted inflation pressures. Food prices saw a 0.2% increase and overall commodity prices rose 0.5%. On an annual basis, energy was up 2.8% and food rose 3.1%. Shelter costs, which comprise about one-third of the weighting in the CPI, rose just 0.2% and were up 3.6% from a year ago. The CPI reading was the only official economic data allowed to be released during the government shutdown.
Fed to the Rescue Again: U.S. Manufacturing Slumps in October but Services Rebound
The Fed cut rates by 25 basis points as expected at its October meeting. The current Fed Funds Rate sits at a range of 3.75%-4%. The Fed also decided to conclude its current quantitative tightening program on December 1 . The decision was not unanimous, as one Fed governor voted for a 50-basis point rate cut and another voted to keep rates steady. Chairman Powell did not provide clarity around future rate cuts but indicated those will be data dependent and will factor in the government shutdown.
Economic activity in the U.S. manufacturing sector contracted in October for the eighth consecutive month. The ISM Manufacturing PMI fell from 49.1 in September to 48.7 in October. Most of the weakness came from the production and prices components. New orders and employment strengthened in October, but most manufacturing gauges remain firmly in contraction territory. The ISM Services PMI surged higher in October. The headline reading of 52.4 was up from 50.0 in September, driven by strength in business activity and new orders. Companies had an optimistic outlook for the overall business environment.
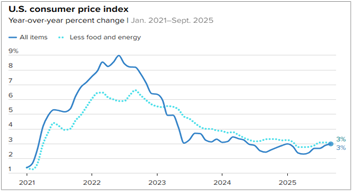
Source: U.S. Bureau of Labor Statistics
Is Europe Regaining its Footing? Inflation Remains in Check but Should Keep the ECB on Sideline
The eurozone Composite PMI hit a 17-month high in October with a reading of 52.2 versus 51.2 in the prior month. The important manufacturing PMI hit 50.0 in October, a two-month high, while the services component hit a 14-month high. New orders saw the strongest jump in over 2.5 years, fueling most of the strength. In addition, employment returned to growth in October and companies in general remained optimistic that output will increase over the coming year. Germany saw a solid increase in output, where the pace of growth hit a 29-month high. Similarly, the euro area excluding Germany and France posted the fastest rise in activity in more than two years.
Inflation in the eurozone edged down in October as higher prices for food and industrial goods were offset by another drop in energy costs. Annual inflation slowed to 2.1%, in line with consensus estimates, from 2.2% in September. Energy prices dropped 0.2% in October, food prices rose 0.7%, and services inflation jumped to an annualized rate of 3.4%. While the latest inflation reading is only a touch above the ECB’s 2% target, the persistence of inflation in the
services sector will likely make the ECB reluctant to lower interest rates any further for the foreseeable future.
China’s Sluggish Economy Continues, Consumer Prices Finally Exit Deflationary Territory
China’s manufacturing activity in October contracted more than expected, slumping to a sixmonth low of 49.0. The October reading missed economists’ estimates of 49.6 and slowed down from 49.8 in September. The sub-indexes tracking production, new orders, raw material inventory, and employment all sunk further into contraction, pointing to a deeper manufacturing slowdown and softer demand. China’s manufacturing activity has remained in contraction since April. The official non-manufacturing PMI, covering construction and services, ticked up to 50.1, boosted by the renewed momentum in air and railway transportation, accommodation, cultural, and sports-related entertainment activities.
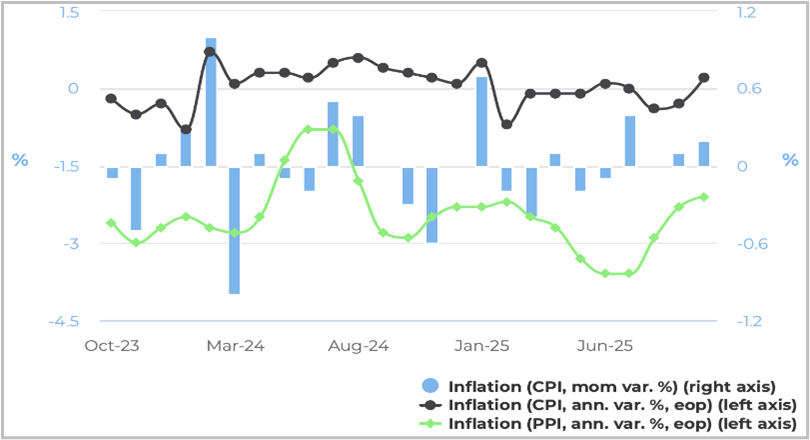
Source: National Bureau of Statistics of China
Health Insurance Costs are Spiraling Out of Control
One of the key points of discussion surrounding the U.S. government shutdown was the cost of healthcare. Over the past 25 years, the average health insurance premium has surged by ~365%.
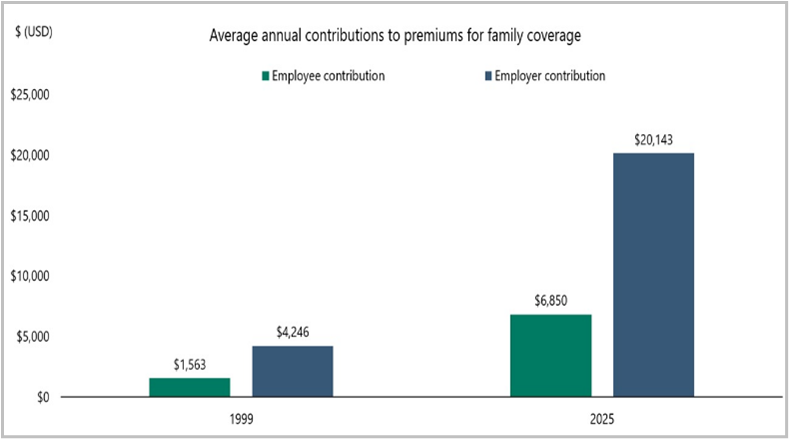
Sources: Kaiser Family Foundation, Apollo Chief Economist
Keep an Eye on How Big Tech is Funding the AI Build Out
October 28th saw the worst S&P 500 breadth recorded ever on a positive performance day, with 104 stocks up versus 398 stocks down. The following day, the five-day 3.6% outperformance of the S&P 500 versus the equal-weighted S&P 500 was the largest outside three observations during COVID over the past ten years. After roughly equal performance between the cap and equal weighted benchmarks through the end of May 2025, the S&P 500 is now up over 16% compared to just 7% for the equal-weighted index. AI spending has driven valuations in U.S. equities with some clear signs of caution away from the important AI trade.
Sources: Kaiser Family Foundation, Apollo Chief Economist
In early November, Meta completed its massive $30B investment grade credit offering. The total order book now exceeds $125B for mega cap tech, a massive increase from 2024 levels and levels seen over the past decade. These massive debt offerings are designed to fund the buildout of data centers across the country. Most of the buildout has been funded through cash flow, but AI capex has reached 94% of operating cash flow. As a result of the issuance surge, 30-year investment grade spreads have increased along with credit default swap levels. Alphabet has come to market with a $17.5B offering in November and rumors are for Amazon to come forward with another mega deal to fund their AI buildout.
The charts and information in this presentation are for illustrative purposes only, and are based upon sources of information that Sunpointe, LLC generally considers reliable, however we cannot guarantee, nor have we verified, the accuracy of such independent market information. The charts and information, and the sources utilized in the compilation thereof, are subjective in nature and open to interpretation. FOR USE WITH INSTITUTIONAL INVESTORS AND INVESTMENT PROFESSIONALS ONLY. NOT FOR PUBLIC DISTRIBUTION. PAST PERFORMANCE IS NO GUARANTEE OF FUTURE RESULTS.